Fibery Downtime Postmortem: All Core's Pods Failed
Drama
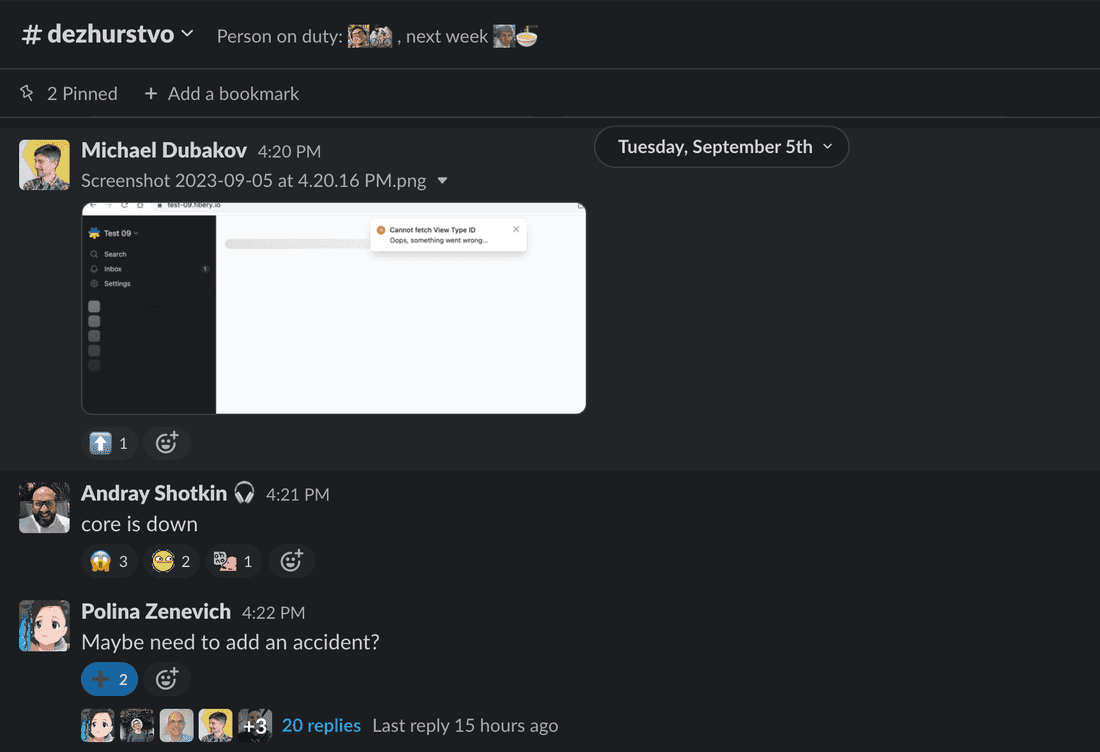
Core crashed in stable cluster on 05.09.2023 at 16:20 Cyprus time (UTC +3). Fibery stopped working at all. For all.
Status → total 🚽.
After Ilya’s magic passes 🪄 with accounts disabling/enabling we could spin cores again.
All cores are up.
Fibery is working. For all.
Downtime period was ~45 minutes.
Observations during downtime
Usually we have 4 instances of the Core in the stable cluster.
All core’s traffic is handling by any of these 4 cores.
If one core feels “unhealthy,” then all HTTP requests handled by the “unhealthy” core also fail. However, the next HTTP requests will be handled by other “healthy” cores. Meanwhile, the “unhealthy” core will be rebooted by the infrastructure.
Infrastructure checks whether a core healthy using following rules (intentionally simplified):
- A healthy core means that the core responds with a 200 HTTP status code to a special healthy HTTP request sent by our cluster infrastructure every 5 seconds. If the heartbeat is okay, then the core is alive and everything is good. Stay alive.
- An unhealthy core means that the core does not respond with a 200 HTTP status code to a special healthy HTTP request sent by our cluster infrastructure every 5 seconds. If the heartbeat is not okay, then the core is considered dead and will be terminated as useless garbage.
Also, the core could fail due to internal reasons, such as an Out Of Memory error. In such cases, the infrastructure notices the failure and restarts the core.
NOTE: Over the past few weeks, the core has been failing periodically with Out Of Memory errors. Although it was not a critical error, Andrew consistently postponed investigating it.
Observation 1
In general, there were 4 unhealthy cores out of the 4 available cores. The cores were being started one by one, but with no success.

Interpretation
The core is starting and cannot return a 200 status for the health check. As a result, the infrastructure considers the core dead and reboots it. This process is repeated for every core that is unhealthy, up to a maximum of 4 unhealthy cores.
Observation 2
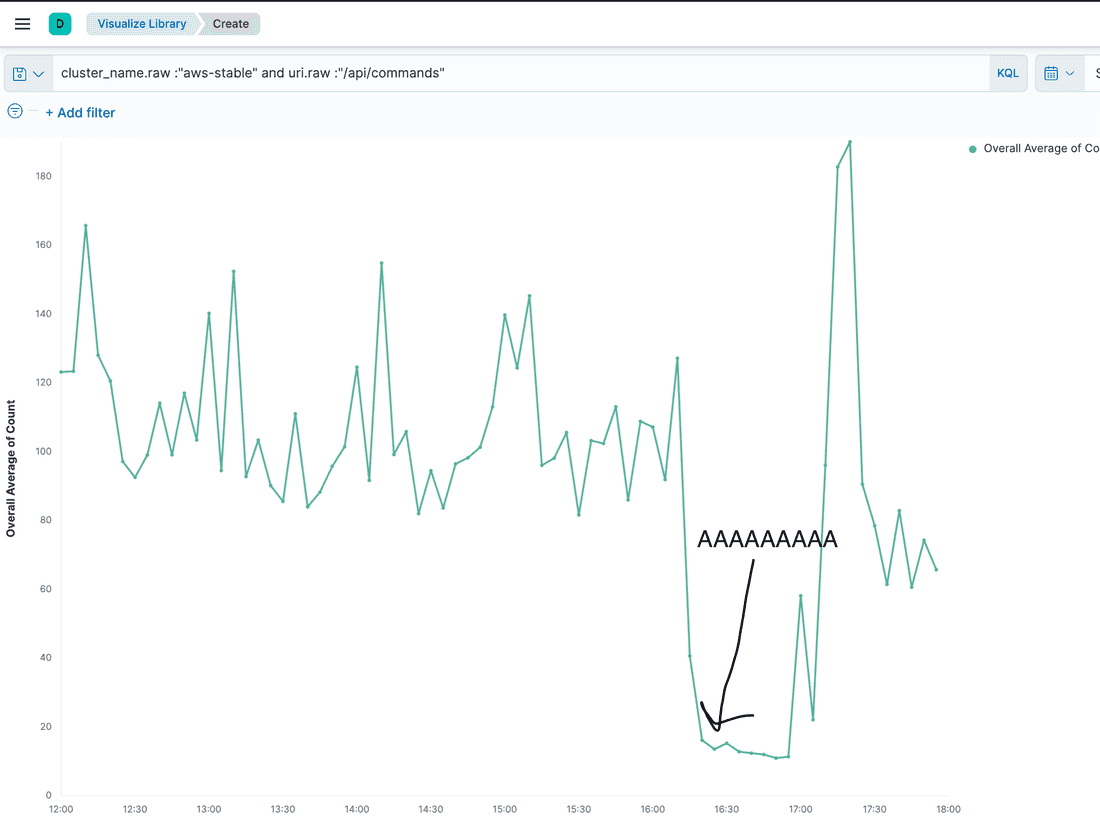
When the core was spinning up, incoming HTTP requests took 50 threads from the available 50 core threads and fully loaded the queue of 500 size for HTTP requests, expecting to be handled.
Interpretation
The current HTTP request’s load takes up all the resources of a single core, causing the health check HTTP requests to fail. The load was120 req/sec on average.
Observation 3
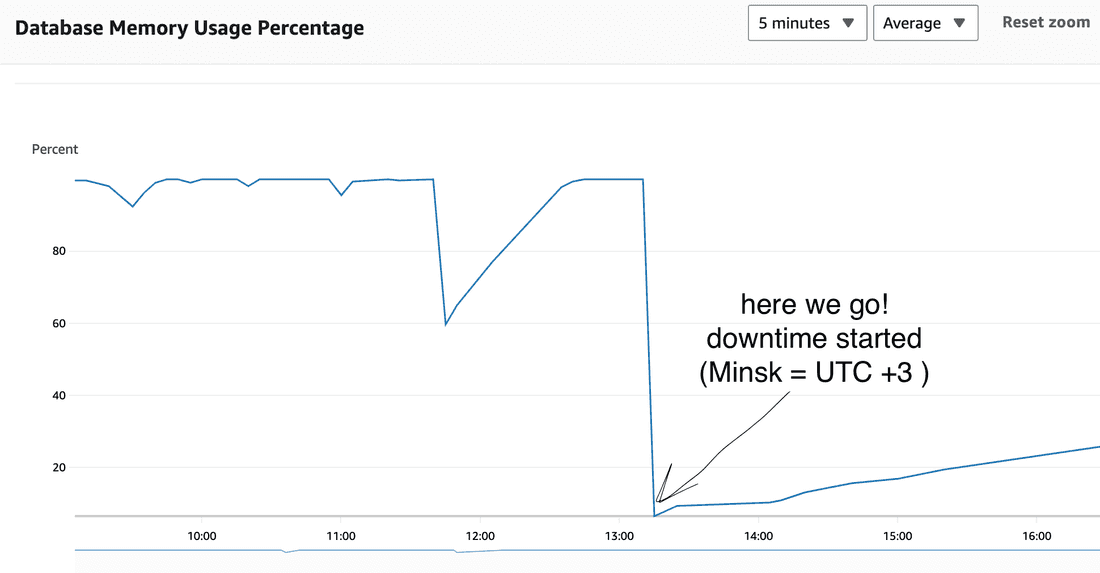
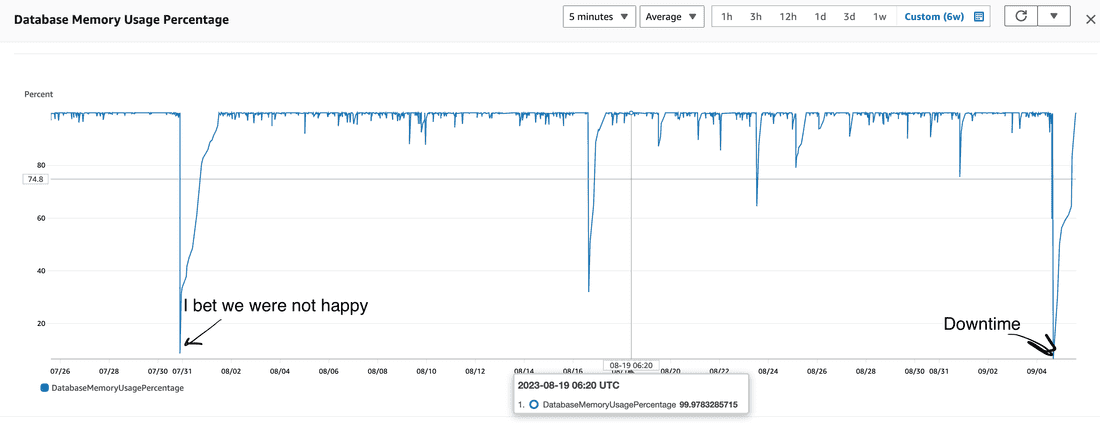
Redis cache was drowned significantly
last 6 weeks:
interpretation
After the core is started, it has a cold memory cache, and we can see that the core also has a cold Redis cache. So, during HTTP request handling, the core has both cache empty and begins to WORK.
Observation 4
Core CPU throttling during downtime

interpretation
Due to cold caches and the amount of traffic, the core tries to work by throttling the CPU.
Observation 5
Work-in-progress cache stores items which are constructed right now.
If other http request needs item which is constructed right now, then it will wait instead of submitting more work.

interpretation
High work-in-progress cache’s usage is observed from 12 pm.
Bunch of dots is a downtime while Redis cache was completely cold. So real work tried to be performed in that time.
NOTE: Having cold Redis cache and current amount of traffic is too much for a _single_ core (other cores are down) so infrastructure decides that core drowned with traffic is unhealthy and kills it.
Redis cache is not warmed so no progress at all and every next core’s reincarnation fails.
Ilya’s magic 🪠
Ilya disabled all accounts, then enabled them by chunks. It gave some time for cores to warm up memory and Redis caches.
External Reason (Hypothesis)
Account xxx.fibery.io complained that they exceeded the limits on fields count on the database because they had a lot of soft deleted fields.
So we advised them to delete them. We found out that xxx.fibery.io submits a high number of schema modification requests during Sep 5:
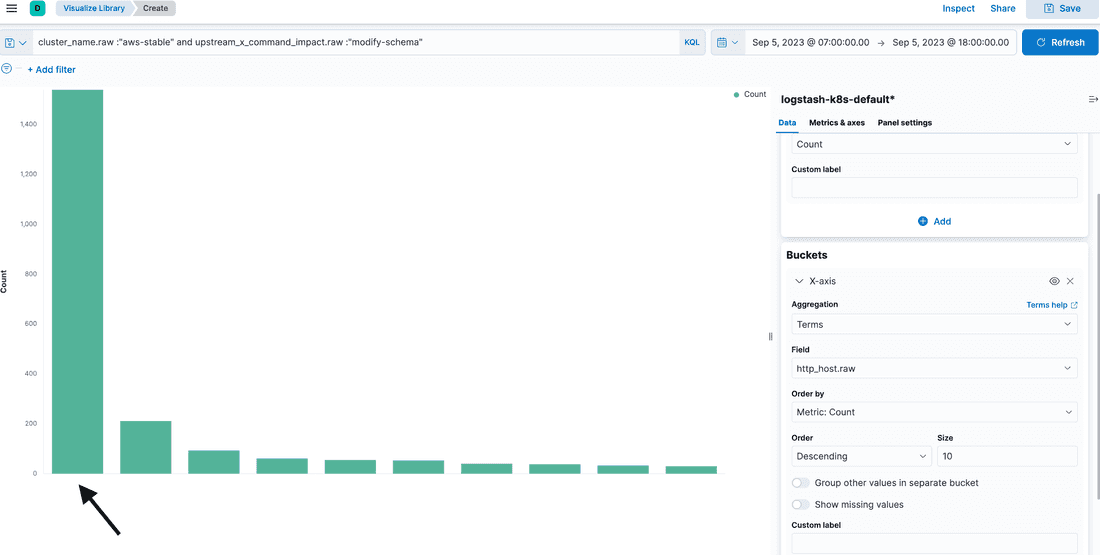
And a huge amount of requests are permanently deleting of soft deleted field ONE BY ONE (yep, following of our advice):

From 12 pm we had suspicious unhealthy cores before incident:
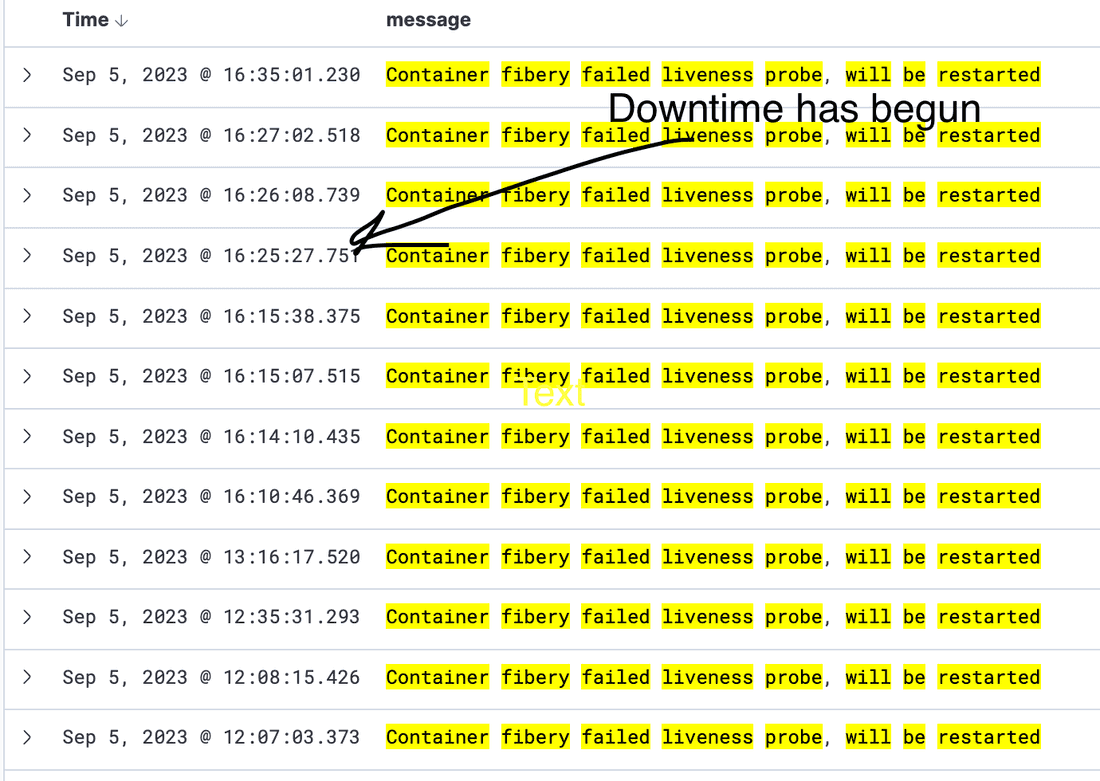
Andrew lazily interpreted them as boring “Out Of Memory” errors, without checking, which he found annoying but not important enough to address immediately. However, he was mistaken.
xxx.fibery.io schemas compressed size is ~3-4 Mb. Every schema modification command schemas new versions are stored in Redis. So 1520 of schema commands give: 1520 * 4 = 6080 Mb to write into Redis. Haha.
The hypothesis is:
- xxx.fibery.io executed a set of schema modification commands and
- Erased Redis cache completely because Redis eviction policy is Least Recently Used then Cores failed and could not start with cold Redis cache under current traffic
Action Items
The strategic goal is to ensure the survival of the Redis cache, even in the event of cold or complete failure. Temporary performance degradation is acceptable, but downtime is not acceptable.
- Clarify accounts Redis hash names to be able observe its size, to evict them, etc. Now hash name is byte encoded mess. Add fibery-core prefix to distinguish core hashes from other services stuff.
- Optimize Core’s work-in-progress algorithm for waiting list to remove redundant work performed by waiters.
- Add metric/alert signalling about dangerous Redis cache memory usage.
- Make core’s health check logic less aggressive.
- Generate design options for explicit core’s control of redis cached items lifecycle.
Psst... Wanna try Fibery? 👀
Infinitely flexible product discovery & development platform.


