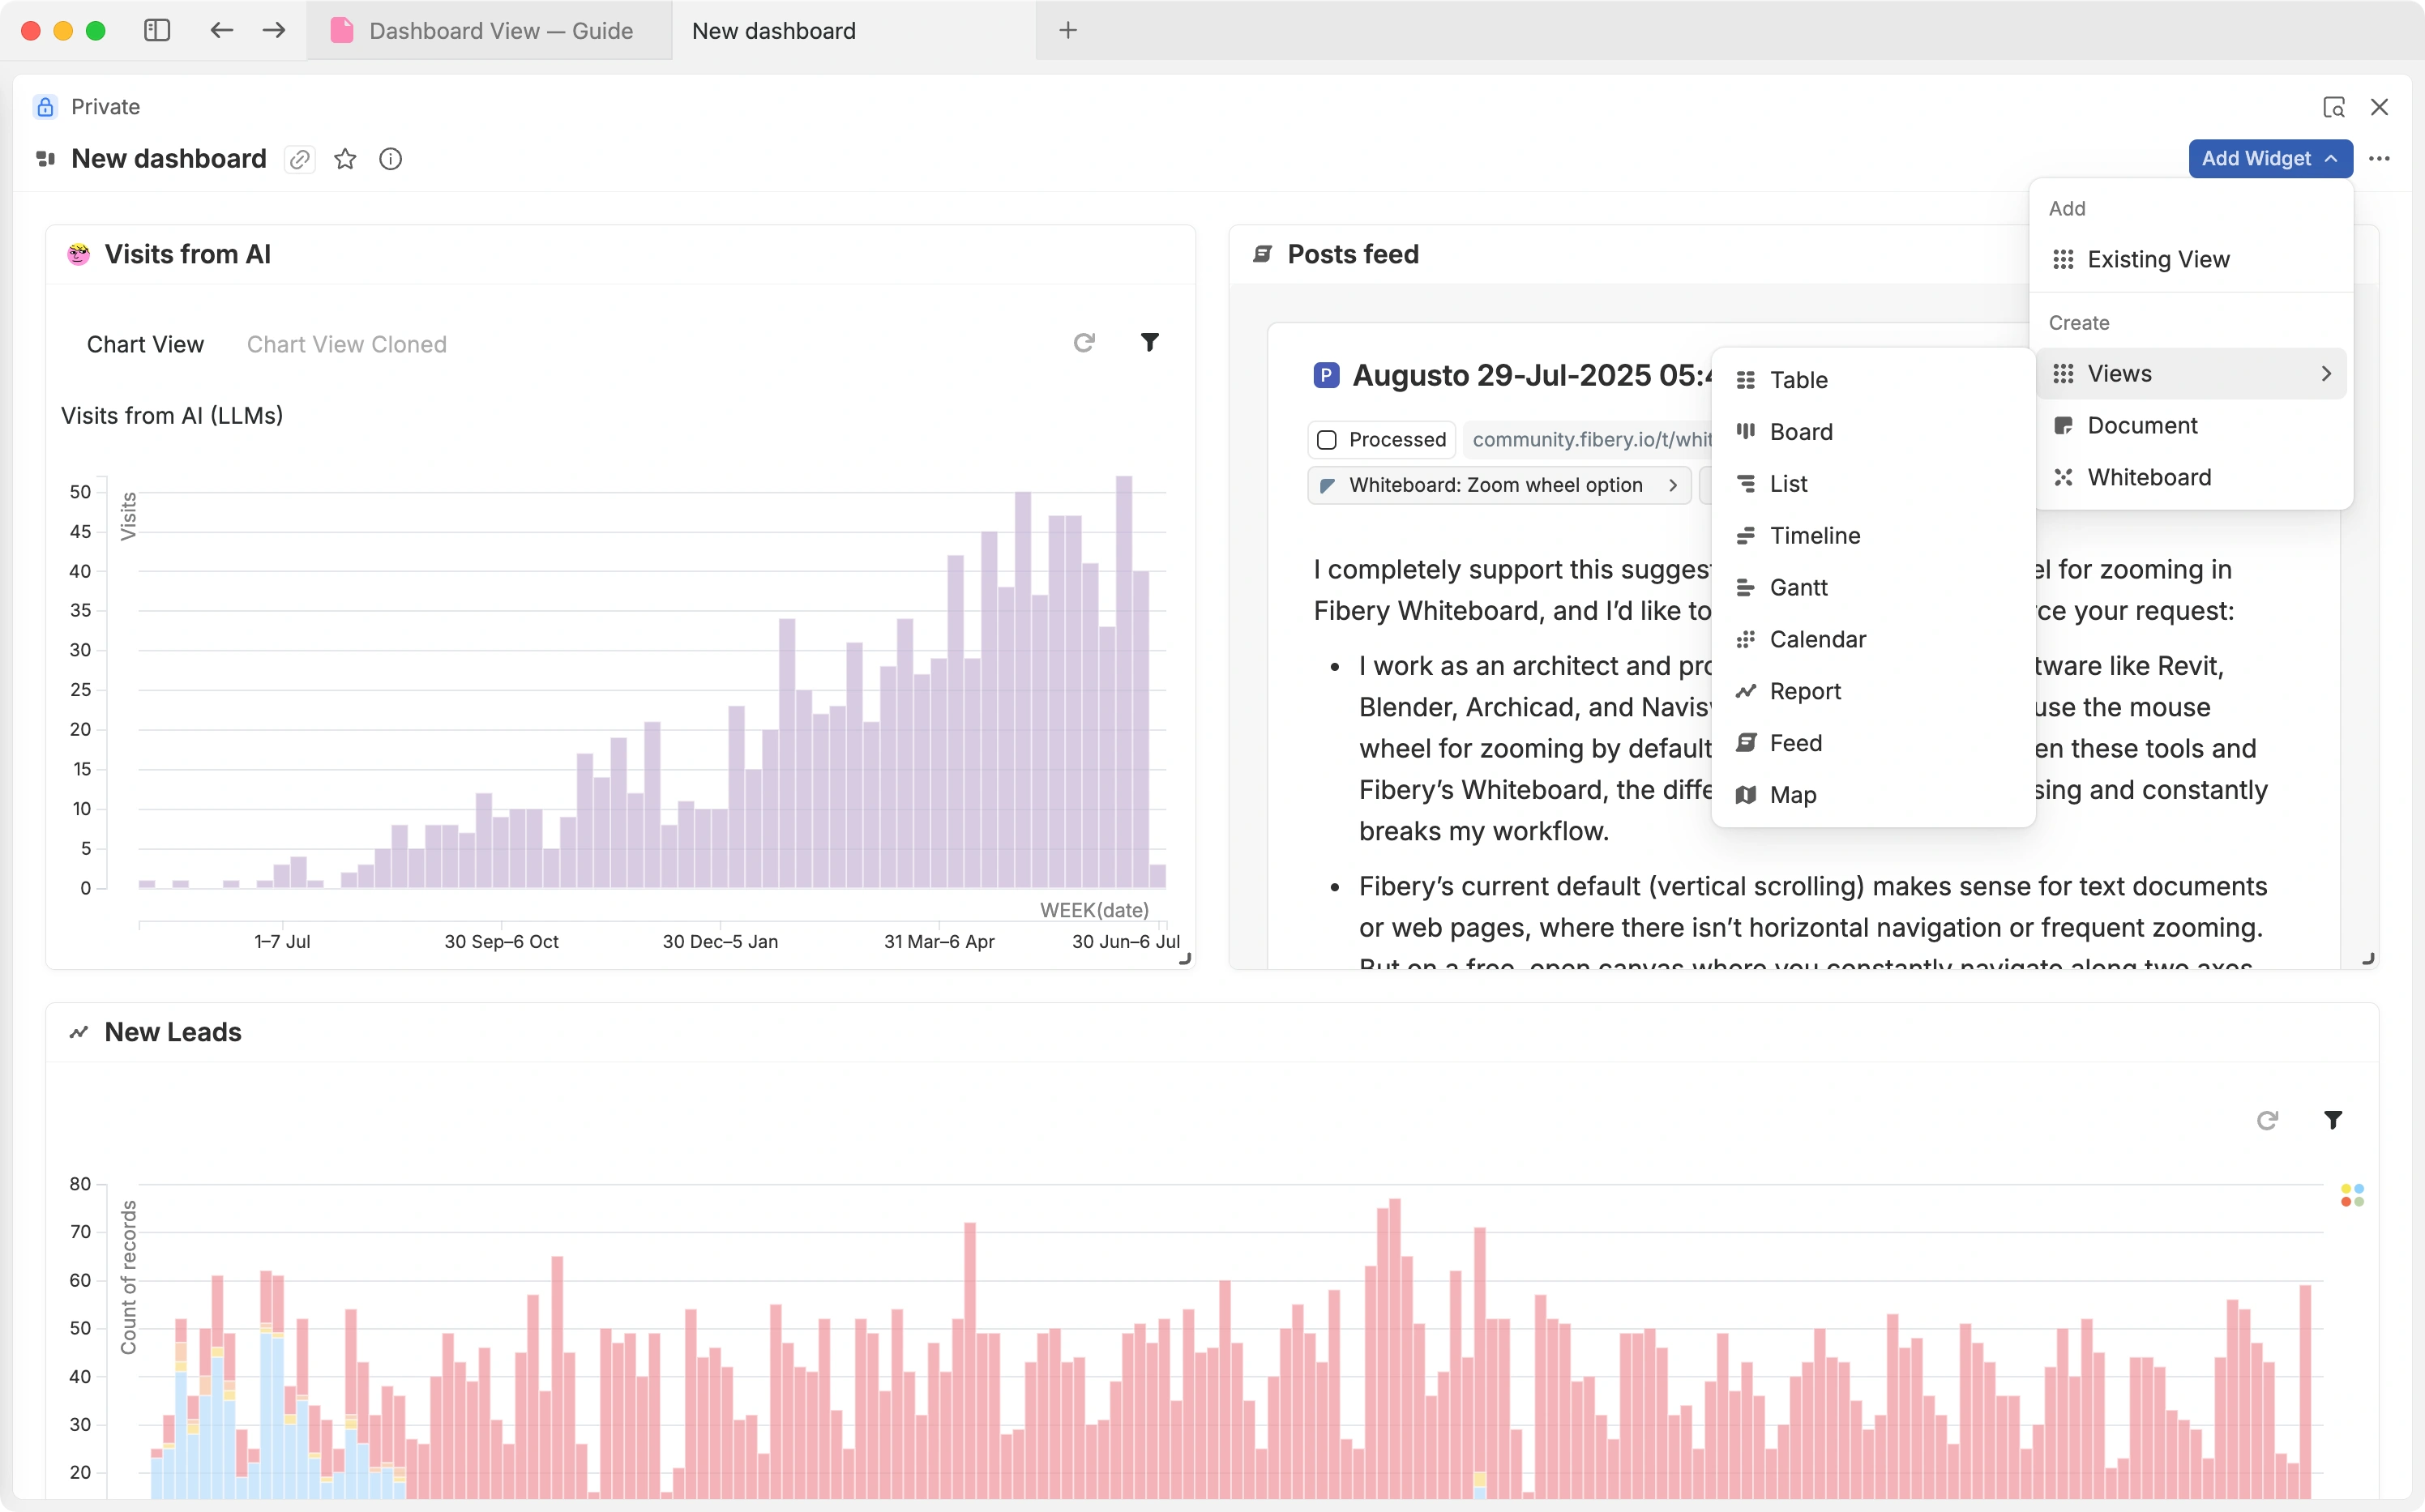
Dashboards
Create Dashboards on top level or inside entities like Projects and Teams. Use existing Views or create new Views right inside Dashboard.
Some more of our best features
Connect AI assistants directly to your Fibery workspace through the Model Context Protocol. Let Claude and other AI tools query and analyze your data, create and update entities, and access Fibery Guide documentation.
Connect AI assistants directly to your Fibery workspace through the Model Context Protocol. Let Claude and other AI tools query and analyze your data, create and update entities, and access Fibery Guide documentation.
Create dependencies, visualize them on the Timeline View, and let dates adjust automatically when moving cards.
Create dependencies, visualize them on the Timeline View, and let dates adjust automatically when moving cards.
Reflect your company structure and build flexible models for any processes using custom entities, custom fields, and custom relations.
Reflect your company structure and build flexible models for any processes using custom entities, custom fields, and custom relations.
Grab outside data from users, co-workers, and potential employees, and store it in Fibery.
Grab outside data from users, co-workers, and potential employees, and store it in Fibery.
Create interactive diagrams, mindmaps, or customer journey maps. Brainstorm and organize ideas and connect them to real work.
Create interactive diagrams, mindmaps, or customer journey maps. Brainstorm and organize ideas and connect them to real work.
Set up granular permissions and define users' powers from creator to viewer.
Set up granular permissions and define users' powers from creator to viewer.
Mix docs with your work. Discuss ideas together in real time, leave comments, mention teammates, create tasks right from the text.
Mix docs with your work. Discuss ideas together in real time, leave comments, mention teammates, create tasks right from the text.
Transform data into information and build powerful custom charts, including burn down, process efficiency, work importance, financial, and more.
Transform data into information and build powerful custom charts, including burn down, process efficiency, work importance, financial, and more.
Add Ideas, Insights, Competitors, and Articles from a Chrome or Firefox web page to your Fibery workspace in two clicks.
Add Ideas, Insights, Competitors, and Articles from a Chrome or Firefox web page to your Fibery workspace in two clicks.
Visualize your data using Board, Timeline, Gantt, Table, List, Calendar, Feed, and Map view.
Visualize your data using Board, Timeline, Gantt, Table, List, Calendar, Feed, and Map view.
Make knowledge discoverable using bi-directional links. Connect feedback to insights, feature ideas to tasks, and more.
Make knowledge discoverable using bi-directional links. Connect feedback to insights, feature ideas to tasks, and more.
Find tasks, documents, contacts, meetings, or any other things using the quick full-text search.
Find tasks, documents, contacts, meetings, or any other things using the quick full-text search.
Share any document or any entity (task, feature, project, etc). Sharing is public and the link never expires.
Share any document or any entity (task, feature, project, etc). Sharing is public and the link never expires.
Track changes happening in documents and work entities (tasks, features, projects, etc) and easily restore the older version.
Track changes happening in documents and work entities (tasks, features, projects, etc) and easily restore the older version.
Connect Fibery to dozens of tools, including Slack, GitLab, GitHub, Jira, Trello, Airtable, ClickUp, Discourse, HubSpot, Braintree, Intercom, Make, and Zapier.
Connect Fibery to dozens of tools, including Slack, GitLab, GitHub, Jira, Trello, Airtable, ClickUp, Discourse, HubSpot, Braintree, Intercom, Make, and Zapier.
Get started with User Research, Roadmapping, Software Development, and 20+ other processes faster with templates created by our team.
Get started with User Research, Roadmapping, Software Development, and 20+ other processes faster with templates created by our team.
Use powerful formulas to calculate both simple and complex metrics for your processes. Cycle Time, Lead Time, Totals, Averages, you name it.
Use powerful formulas to calculate both simple and complex metrics for your processes. Cycle Time, Lead Time, Totals, Averages, you name it.
Automate repetitive actions, do less manual work, and keep all the data consistent using Fibery Automation rules.
Automate repetitive actions, do less manual work, and keep all the data consistent using Fibery Automation rules.
Replace the same set of actions you do in Fibery periodically with a single click on an automated Action Button.
Replace the same set of actions you do in Fibery periodically with a single click on an automated Action Button.
Show filtered and sorted list of entities in Fibery navigation menu and create Views inside entities using Smart Folders.
Show filtered and sorted list of entities in Fibery navigation menu and create Views inside entities using Smart Folders.
Import data into Fibery from a CSV file. Select fields to import and set required field types.
Import data into Fibery from a CSV file. Select fields to import and set required field types.
Integrate Fibery with external systems you use, create powerful workflows, and automate routine tasks using Fibery API.
Integrate Fibery with external systems you use, create powerful workflows, and automate routine tasks using Fibery API.
Put customer locations, events, offices, or your favorite lunch places on the map.
Put customer locations, events, offices, or your favorite lunch places on the map.
Try for free till you 🖤 it, or till trial expires 🤷A 14-day trial is on us. No credit card required.
Dig into workspaces & workflows of some companies:
How Lemonade's tech team connects strategy to execution in Fibery
Lemonade
customer story
How Lemonade's tech team connects strategy to execution in Fibery
Lemonade
customer story
How to organize hardware & software development in Fibery
Anything Connected
customer story
How to organize hardware & software development in Fibery
Anything Connected
customer story
How e-com startup tests assumptions and spots product opportunities
Outfindo
customer story
How e-com startup tests assumptions and spots product opportunities
Outfindo
customer story
How PowerX tracks development and prototypes work in Fibery
PowerX
customer story
How PowerX tracks development and prototypes work in Fibery
PowerX
customer story
